Photo essays of visibly distressed landscapes in the urban American West. Our health, and our landscape, is being destroyed by the toxic components of the air pollution we generate. These photo essays, centered mostly in Santa Barbara, CA, and Portland, OR, serve as stark reminders.
If the map is colored green it is either healthy, slightly less than unhealthy, or there is no instruments measuring air pollution in the area.
Yellow, orange, and red signify unhealthy air.
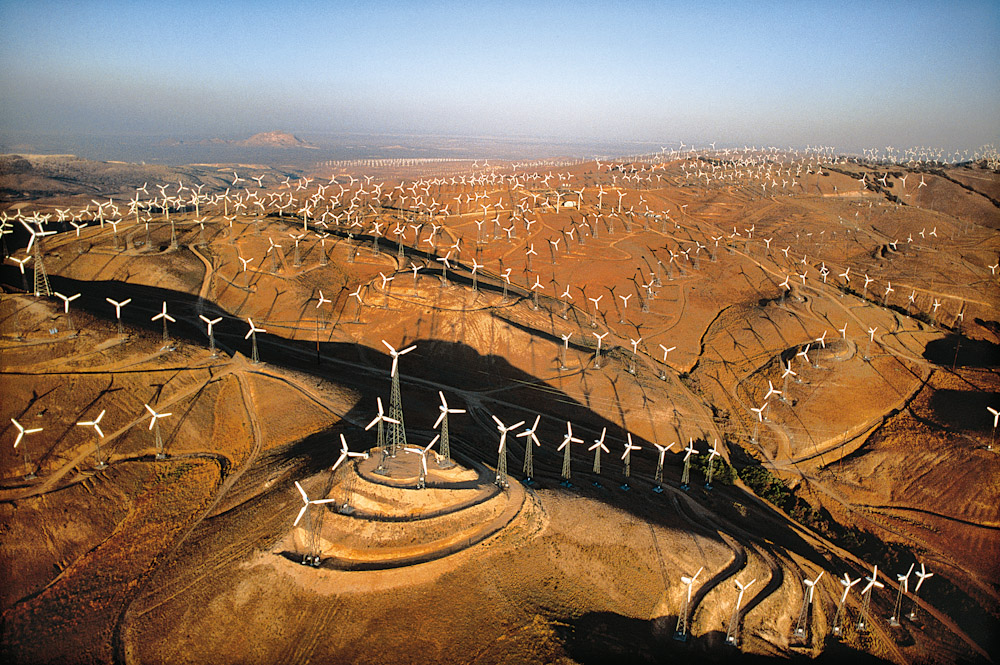
California's Central Valley, a.k.a. The Salad Bowl of the World, also collects and generates enormous amounts of unhealthy ozone and fine particulate pollution. This AIRNow animated map shows a one days cycle of these dangerous pollutants. Just left-of-center near the bottom of the map and just above Los Angeles is the southern edge of the Central Valley. Much of the air entering the valley began as relatively fresh sea air off of the Pacific. As the air traveled through San Fransisco and San Jose, it began picking up pollution from those metro areas then flowed to the bottom of the valley, accumulating more pollutants.The Valley's pollution then spills over the Tehachapi Mountains, the site of many wind turbines, into the high deserts north of Los Angeles. This is a normal cycle of air mixing and pollution generation for this area
Below is an animated color coded map of ozone and fine particulate air pollution as it goes through its forecast cycle. Areas colored warmer than green signify unhealthy levels of listed pollutants.


